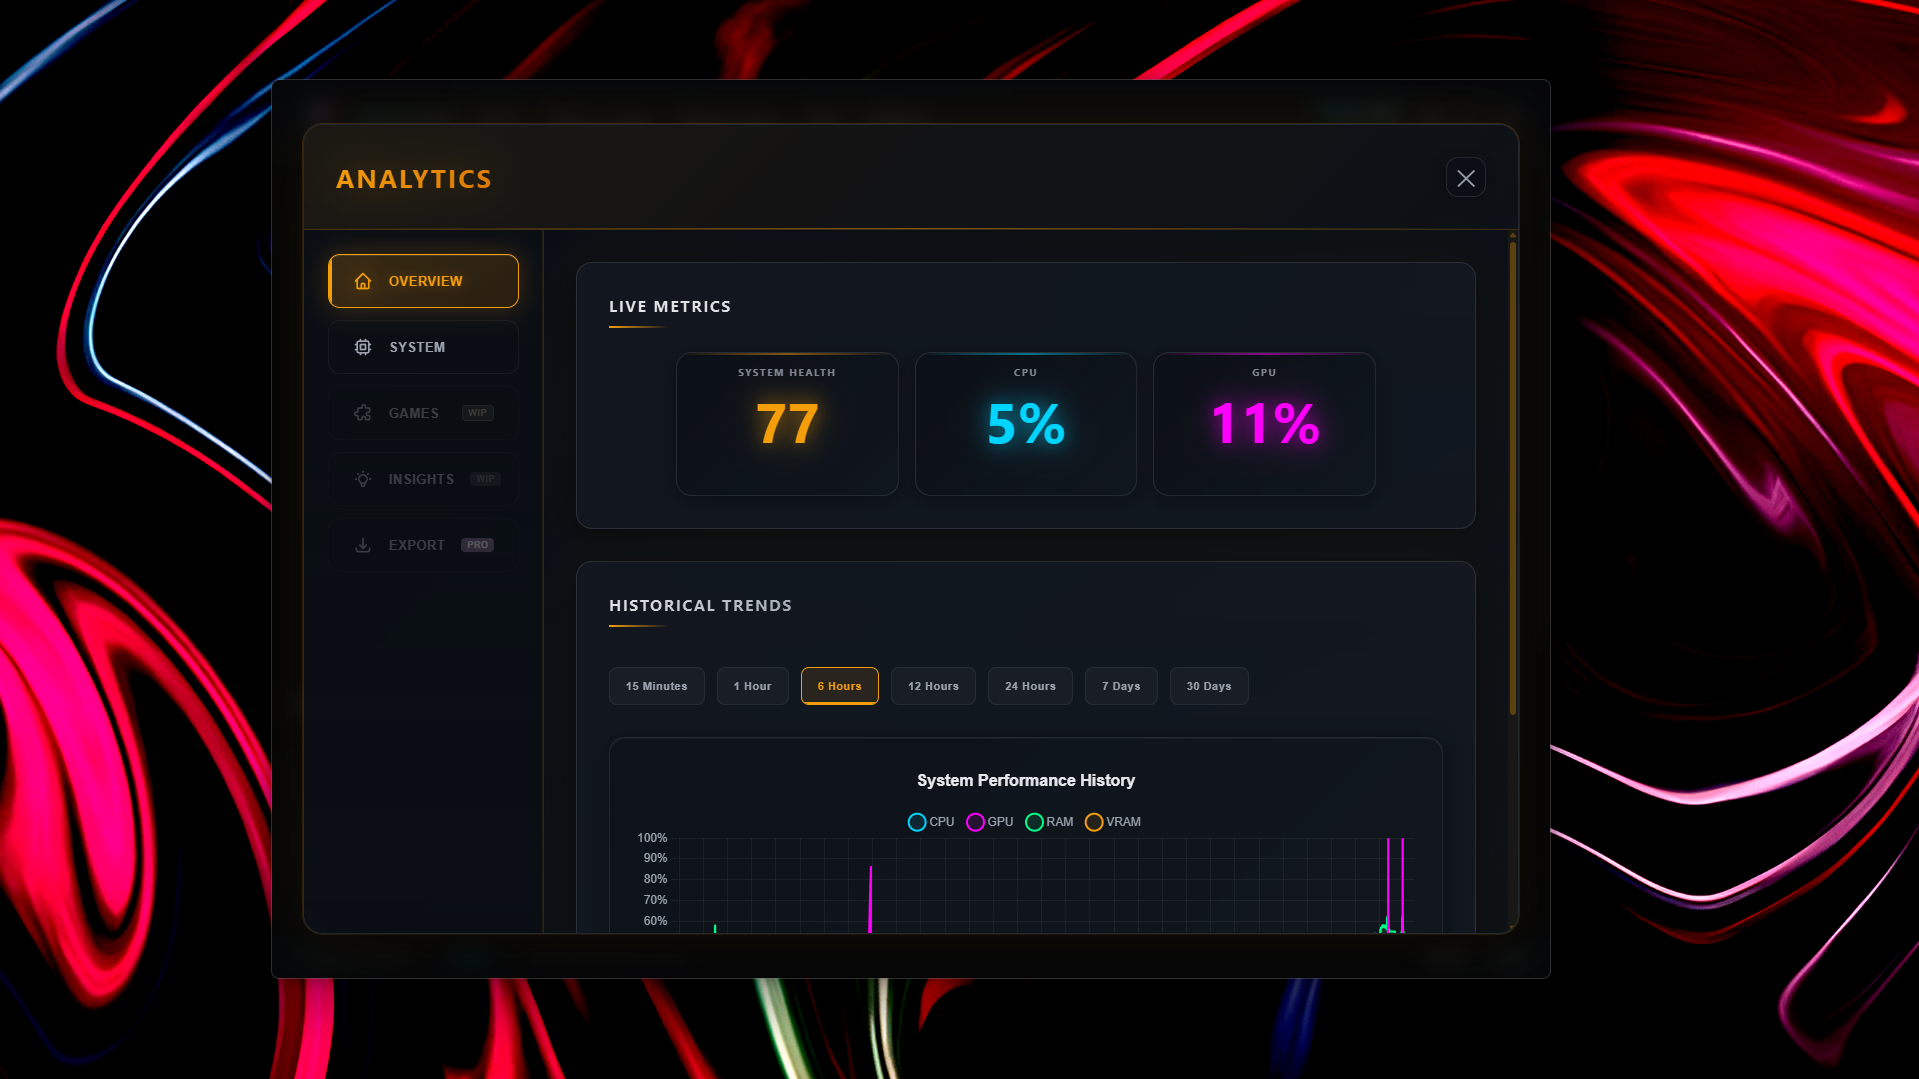
Analytics Overview
Frameshift's analytics system continuously collects performance metrics and stores them in a local database, allowing you to track system performance over extended periods and identify trends, bottlenecks, and optimization effectiveness.

Data Collection
Analytics data is collected automatically in the background without impacting system performance.
Metrics Collected
Frameshift tracks the following metrics every 5 seconds:
| Metric Category | Data Points | Unit |
|---|---|---|
| CPU Usage | Overall processor utilization | Percentage (0-100%) |
| GPU Usage | Graphics processor utilization | Percentage (0-100%) |
| RAM Usage | System memory utilization | Percentage (0-100%) |
| VRAM Usage | Video memory utilization | Percentage (0-100%) |
| Disk I/O | Read and write throughput | MB/s |
| Network I/O | Upload and download speed | Mbps |
Collection Frequency
Data collection adapts based on application focus to minimize resource usage:
- Active window: Metrics collected every 5 seconds at full granularity
- Background window: Collection continues every 5 seconds
- Minimized to tray: Collection continues with reduced frequency
Time Ranges
View your performance data across multiple time ranges to identify short-term issues or long-term trends.
15 Minutes
Real-time view with 1-second granularity. Ideal for monitoring active gaming sessions or testing optimization changes.
1 Hour
5-second granularity for recent performance. Useful for tracking gaming sessions or workload patterns.
6 Hours
30-second granularity for broader context. Track performance across multiple gaming sessions.
12 Hours
1-minute granularity for half-day analysis. Compare morning vs evening performance.
1 Day
1-minute granularity for full-day insights. See how your system performs throughout the day.
7 Days
5-minute granularity for weekly trends. Identify patterns and track optimization impact.
30 Days
5-minute granularity for monthly analysis. Long-term performance monitoring and hardware degradation tracking.
Performance Statistics
For each time range, Frameshift calculates comprehensive statistics to help you understand system behavior.
Available Statistics
| Statistic | Description | Use Case |
|---|---|---|
| Minimum | Lowest recorded value | Identify idle/baseline performance |
| Maximum | Highest recorded value | Identify peak loads and spikes |
| Average | Mean value across time range | Overall system utilization |
| Median | 50th percentile value | Typical performance (not skewed by spikes) |
| 95th Percentile | 95% of values below this point | Sustained performance under load |
| 99th Percentile | 99% of values below this point | Worst-case performance |
Data Visualization
Analytics data is displayed as interactive charts with multiple visualization options.
Chart Types
Line Charts
Show performance trends over time. Toggle individual metrics on/off for focused analysis.
Comparison View
Overlay multiple metrics on one chart to identify correlations and bottlenecks.
Individual Metric View
Focus on a single metric (CPU, GPU, RAM, etc.) with detailed scale and annotations.
Data Export PRO
Export your analytics data for external analysis, reporting, or archival purposes.
Export Formats
- CSV (Comma-Separated Values): Compatible with Excel, Google Sheets, and data analysis tools
- JSON (JavaScript Object Notation): Structured data format for programming and automation
How to Export Data
-
Open Analytics Tab
Navigate to the Analytics section from the main dashboard.
-
Select Time Range
Choose the time range you want to export (15 minutes to 30 days).
-
Click Export Button
Click the "Export Data" button in the top-right of the analytics view.
-
Choose Format and Save
Select CSV or JSON format and choose a save location. The file will include all metrics and timestamps for the selected range.
Database Storage
Analytics data is stored locally on your system using SQLite (compiled to WebAssembly via SQL.js).
Storage Location
The analytics database is located at:
%APPDATA%\Frameshift\analytics.db
Database Management
- Automatic cleanup: Data older than 30 days is removed daily
- Typical size: 50-100 MB for 30 days of data
- Backup: Database file can be manually copied for backup
- Clear data: Delete database file to start fresh (app will recreate it)
Using Analytics Effectively
Here are some practical ways to use analytics data to improve your system performance:
Identifying Bottlenecks
- CPU at 100%, GPU low: CPU bottleneck - optimize CPU settings or upgrade processor
- GPU at 100%, CPU low: GPU bottleneck - adjust graphics settings or upgrade GPU
- RAM near 100%: Memory bottleneck - close background apps or add more RAM
- High VRAM usage: Reduce texture quality or graphics settings in games
Measuring Optimization Impact
Follow these steps to quantify the effectiveness of optimizations:
- Export analytics data for your typical usage (1 day or 7 days)
- Note the average and 95th percentile values for CPU, GPU, and RAM
- Apply Frameshift optimizations
- Use your system normally for the same duration
- Export analytics data again and compare metrics
- Look for reductions in average usage and improved 1% low FPS in games
Tracking Long-Term Trends
Use 7-day and 30-day views (Pro) to identify:
- Performance degradation: Gradual increase in baseline CPU/GPU usage may indicate malware or bloatware accumulation
- Temperature trends: Rising temperatures over time may indicate dust buildup or thermal paste degradation
- Usage patterns: Identify peak usage times and optimize your schedule accordingly