Dashboard Overview
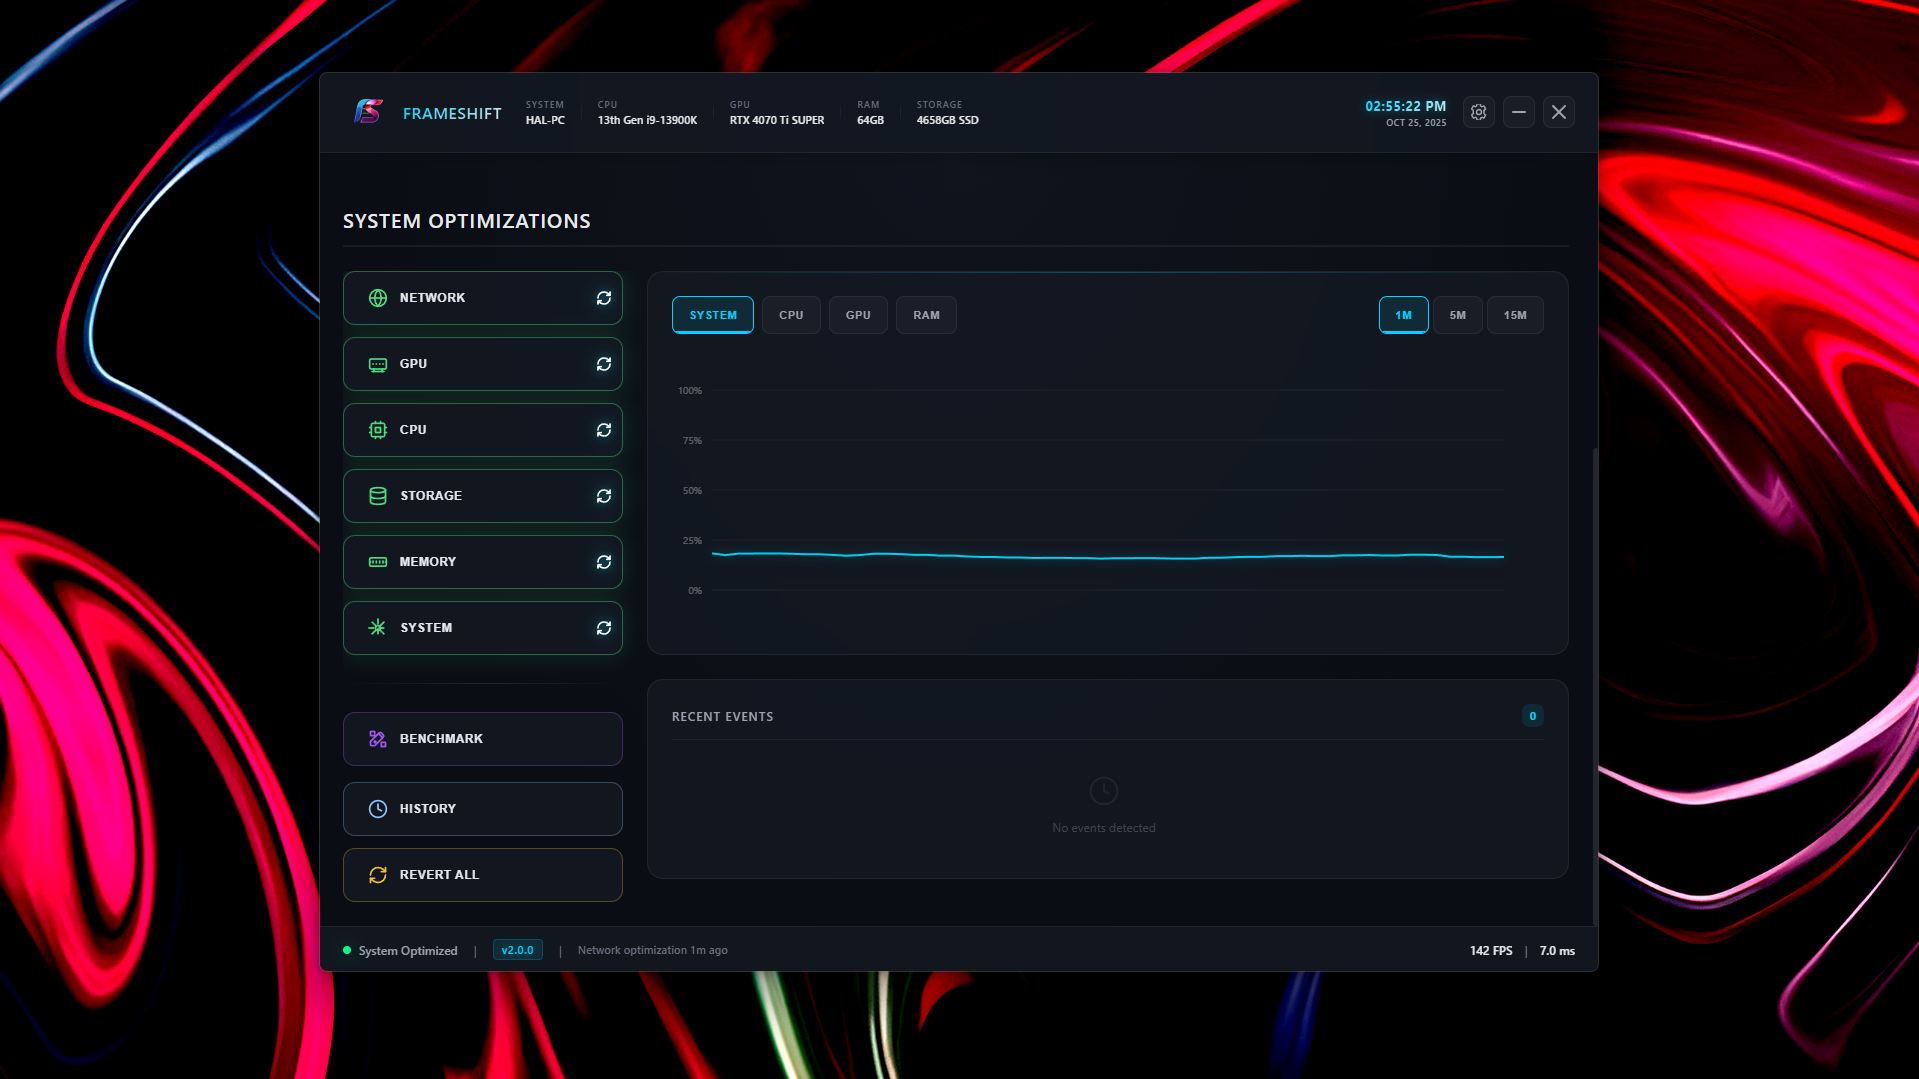
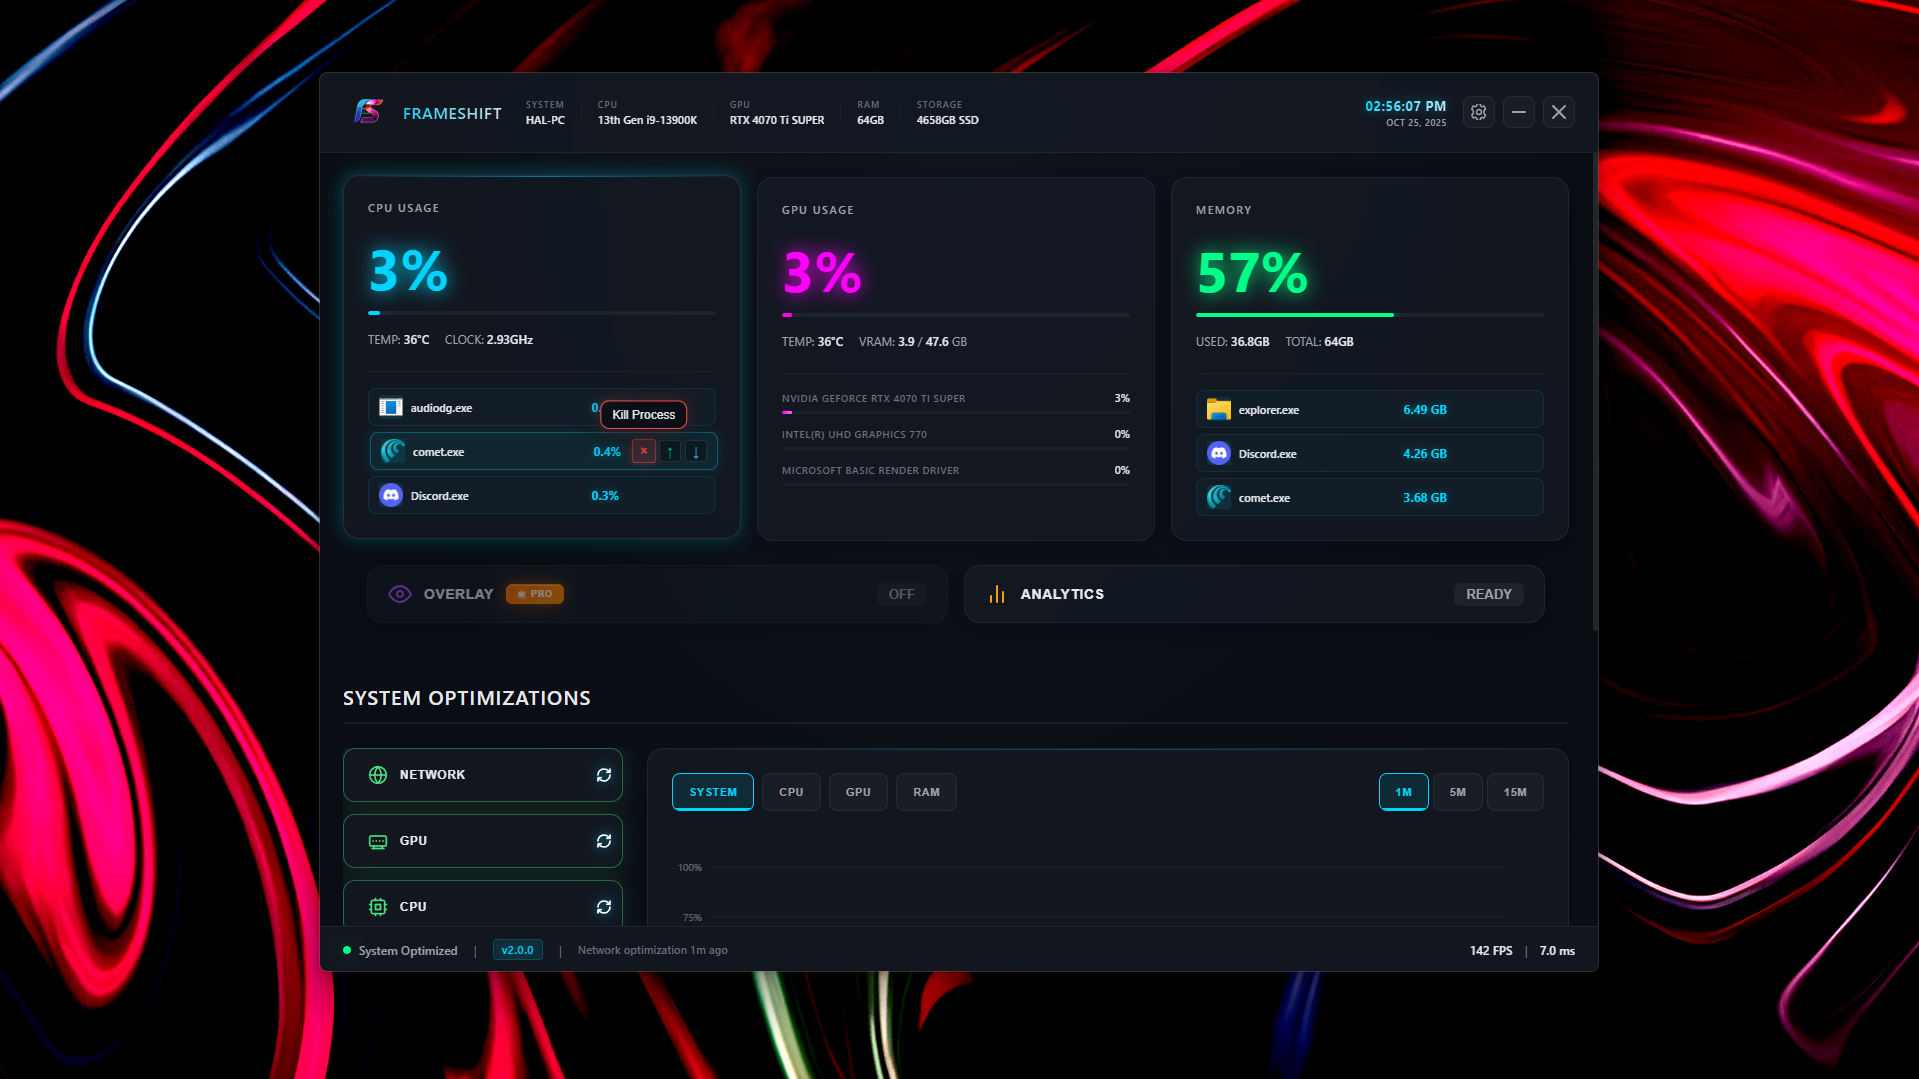
The Frameshift dashboard is your command center for monitoring system performance. It provides real-time metrics, performance graphs, process monitoring, and event detection all in one view.

System Header
The header displays critical system information at a glance:
System Information
- Computer Name: Your system's hostname
- CPU Model: Processor name and specifications
- GPU Name: Graphics card model and details
- Total RAM: System memory capacity (formatted)
- Storage: Drive type (NVMe/SSD/HDD) and capacity
- Current Time & Date: Live clock display
Real-Time Metric Cards
Three large metric cards display live performance data with color-coded accents:
CPU Card (Cyan)
- Current CPU usage percentage
- CPU temperature (Celsius)
- Current clock speed (GHz)
- Visual progress bar
GPU Card (Magenta)
- Current GPU usage percentage
- GPU temperature (Celsius)
- VRAM usage (GB)
- Visual progress bar
Memory Card (Green)
- Current RAM usage percentage
- Memory used (GB)
- Total memory (GB)
- Visual progress bar
Performance Graphs
The interactive performance graph visualizes system metrics over time with historical data tracking up to 15 minutes (900 data points at 1-second intervals).

Graph Modes
Toggle between four different visualization modes:
| Mode | What it Shows |
|---|---|
| Performance | All three metrics (CPU, GPU, RAM) on one graph with color-coded lines |
| CPU | CPU usage only with detailed view and larger scale |
| GPU | GPU usage only with detailed view and larger scale |
| RAM | Memory usage only with detailed view and larger scale |
Event Detection System
Frameshift automatically detects and alerts you to important system events based on real-time monitoring.
Event Types
CPU Spike
Triggered when CPU usage exceeds 90% for sustained periods. Indicates high processor load.
GPU Spike
Triggered when GPU usage exceeds 95%. Normal during gaming or rendering tasks.
RAM Critical
Triggered when RAM usage exceeds 90%. System may start using slower swap/page file.
VRAM Critical
Triggered when video memory exceeds 85%. May cause texture quality reduction in games.
Game Detected
Triggered when a supported game is launched. Enables automatic game optimizations.
Optimization Complete
Triggered when system optimizations are successfully applied.
Process Monitoring
Track which applications are consuming system resources with real-time process monitoring.

Process Lists
Two separate lists display resource usage:
Top CPU Processes
Shows processes consuming the most CPU time. Each entry displays process name, icon, and current CPU percentage.
Top Memory Processes
Shows processes using the most RAM. Each entry displays process name, icon, and memory usage in MB/GB.
Process Actions
Hover over any process to reveal action buttons:
- Kill Process: Immediately terminate the selected process (requires confirmation)
- Set Priority: Change process priority from -2 (lowest) to 3 (highest)
System Tray Integration
Frameshift can run in the background with system tray integration for quick access to metrics.
Tray Features
- Live Tooltip: Hover over the tray icon to see current CPU, GPU, and Memory usage
- Quick Toggle: Left-click to show/hide the main window
- Context Menu: Right-click for quick actions and current stats
- Run in Background: Enable in settings to keep monitoring even when window is closed
Customization Options
Customize the dashboard to suit your preferences:
- Metric Update Rate: Adjust polling frequency in settings (default: 250ms)
- Graph History Length: Configure data points to display (default: 900 points = 15 minutes)
- Event Notifications: Choose which events trigger notifications
- Process List Size: Configure number of processes to display